Two weeks ago I participated in a BioBE Design Champs webinar on Daylight and Microbes. Find out more here.
Tag: microorganisms

Field notes from my first ESA meeting
![IMG_20170808_083850[4637].jpg](https://sueishaqlab.org/wp-content/uploads/2017/08/img_20170808_0838504637.jpg?w=162&h=218)
In particular, it was intriguing to attend talks on the ecology of the human microbiome. Due to the complexity of host-associated microbial communities, and the limitations of technology, the majority of studies to date have been somewhat observational. We have mapped what is present in different animals, in different areas of the body, under different diet conditions, in different parts of the world, and in comparison between healthy and disease states. But given the complexity of the day-to-day life of people, and ethics or technical difficulty of doing experimental studies in humans, many of the broader ecological questions have yet to be answered.
For example, how quickly do microbial communities assemble in humans? When you disturb them or change something (like adding a medication or removing a food from your diet) how quickly does this manifest in the community structure and do those changes last? How does dysbiosis or dysfunction in the body specifically contribute to changes in the microbial community, or do seemingly harmless events trigger a change in the microbial community which then causes disease in humans? Some of the presentations I attended have begun teasing out these problems with a combination of observational in situ biological studies, in vitro laboratory studies, and in silico mathematical modeling. The abstracts from all the meeting presentations can be found on the meeting website under Program. I have also summarized several of the talks I went to on Give Me The Short Version.
One of my favorite parts was attending an open lunch with 500 Women Scientists, a recently-formed organization which promotes diversity and equality in science, and supports local activists to help change policy and preconceived notions about diversity in STEM. The lunch meeting introduced the organization to the conference participants in attendance, asked us to voice our concerns or difficulties we had faced, encouraged us to reach out to others in our work network to seek advice and provide mentoring, and walked us through exercises designed to educate on how to build a more inclusive society.

My poster presentation was on Wednesday, halfway through the meeting week, which gave me plenty of time to prepare. You never know who might show up at your poster and what questions they’ll have. In the past, I’ve always had a steady stream of people to chat with at my poster which has led to a number of scientific friendships and networking, and this year was no different. The rather large (but detailed) poster file can be found here: Ishaq et al ESA 2017 poster . Keep in mind that this is preliminary work, and many statistical tests have not yet been applied or verified. I’ve been working to complete the analysis on the large study, which also encompasses a great deal of environmental data. We hope to have manuscript drafted by this fall on this part of the project, and several more over the next year from the research team as this is part of a larger study; stay tuned!
Presentation on maternal influences on the calf digestive tract from JAM 2016 available!
The video presentation of my work on the effects of maternal biotic influences on the developing calf digestive tract bacteria is finally available for public use!
Abstract 1522: Influence of colostrum on the microbiological diversity of the developing bovine intestinal tract

Preparing for my first greenhouse trial
As the 2016 growing season comes to a close in Montana, here in the lab we aren’t preparing to overwinter just yet. In the last few weeks, I have been setting up my first greenhouse trial to expand upon the work we were doing in the field. My ongoing project is to look at changes in microbial diversity in response to climate change. The greenhouse trial will expand on that by looking at the potential legacy effects of soil diversity following climate change, as well as other agricultural factors.
First, though, we had to prep all of our materials, and since we are looking at microbial diversity, we wanted to minimize the potential for microbial influences. This meant that the entire greenhouse bay needed to be cleaned and decontaminated. To mitigate the environmental impact of our research, we washed and reused nearly 700 plant pots and tags in order to reduce the amount of plastic that will end up in the Bozeman landfill.

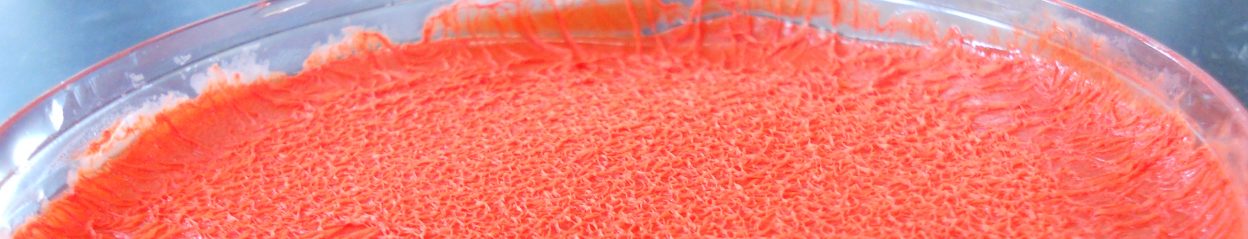
Each pot needed to be scrubbed with disinfectant soap and then soaked in bleach.

Lines of pots drying on the rack.

I scrubbed 700 labels clean in order to reuse them.
We also needed to autoclave all our soil before we could use it, to make sure we are starting with only the microorganisms we are intentionally putting in. These came directly from my plots in the field study, and are being used as an inoculum, or probiotic, into soil as we grow a new crop of wheat.
This is trial one of three, each of which has three phases, so by the end of 2016 I’ll have cleaned and put soil into 648 pots with 648 tags; planted, harvested, dried and weighed 11,664 plants; and sampled, extracted DNA from, sequenced, and analyzed 330 soil and environmental samples!

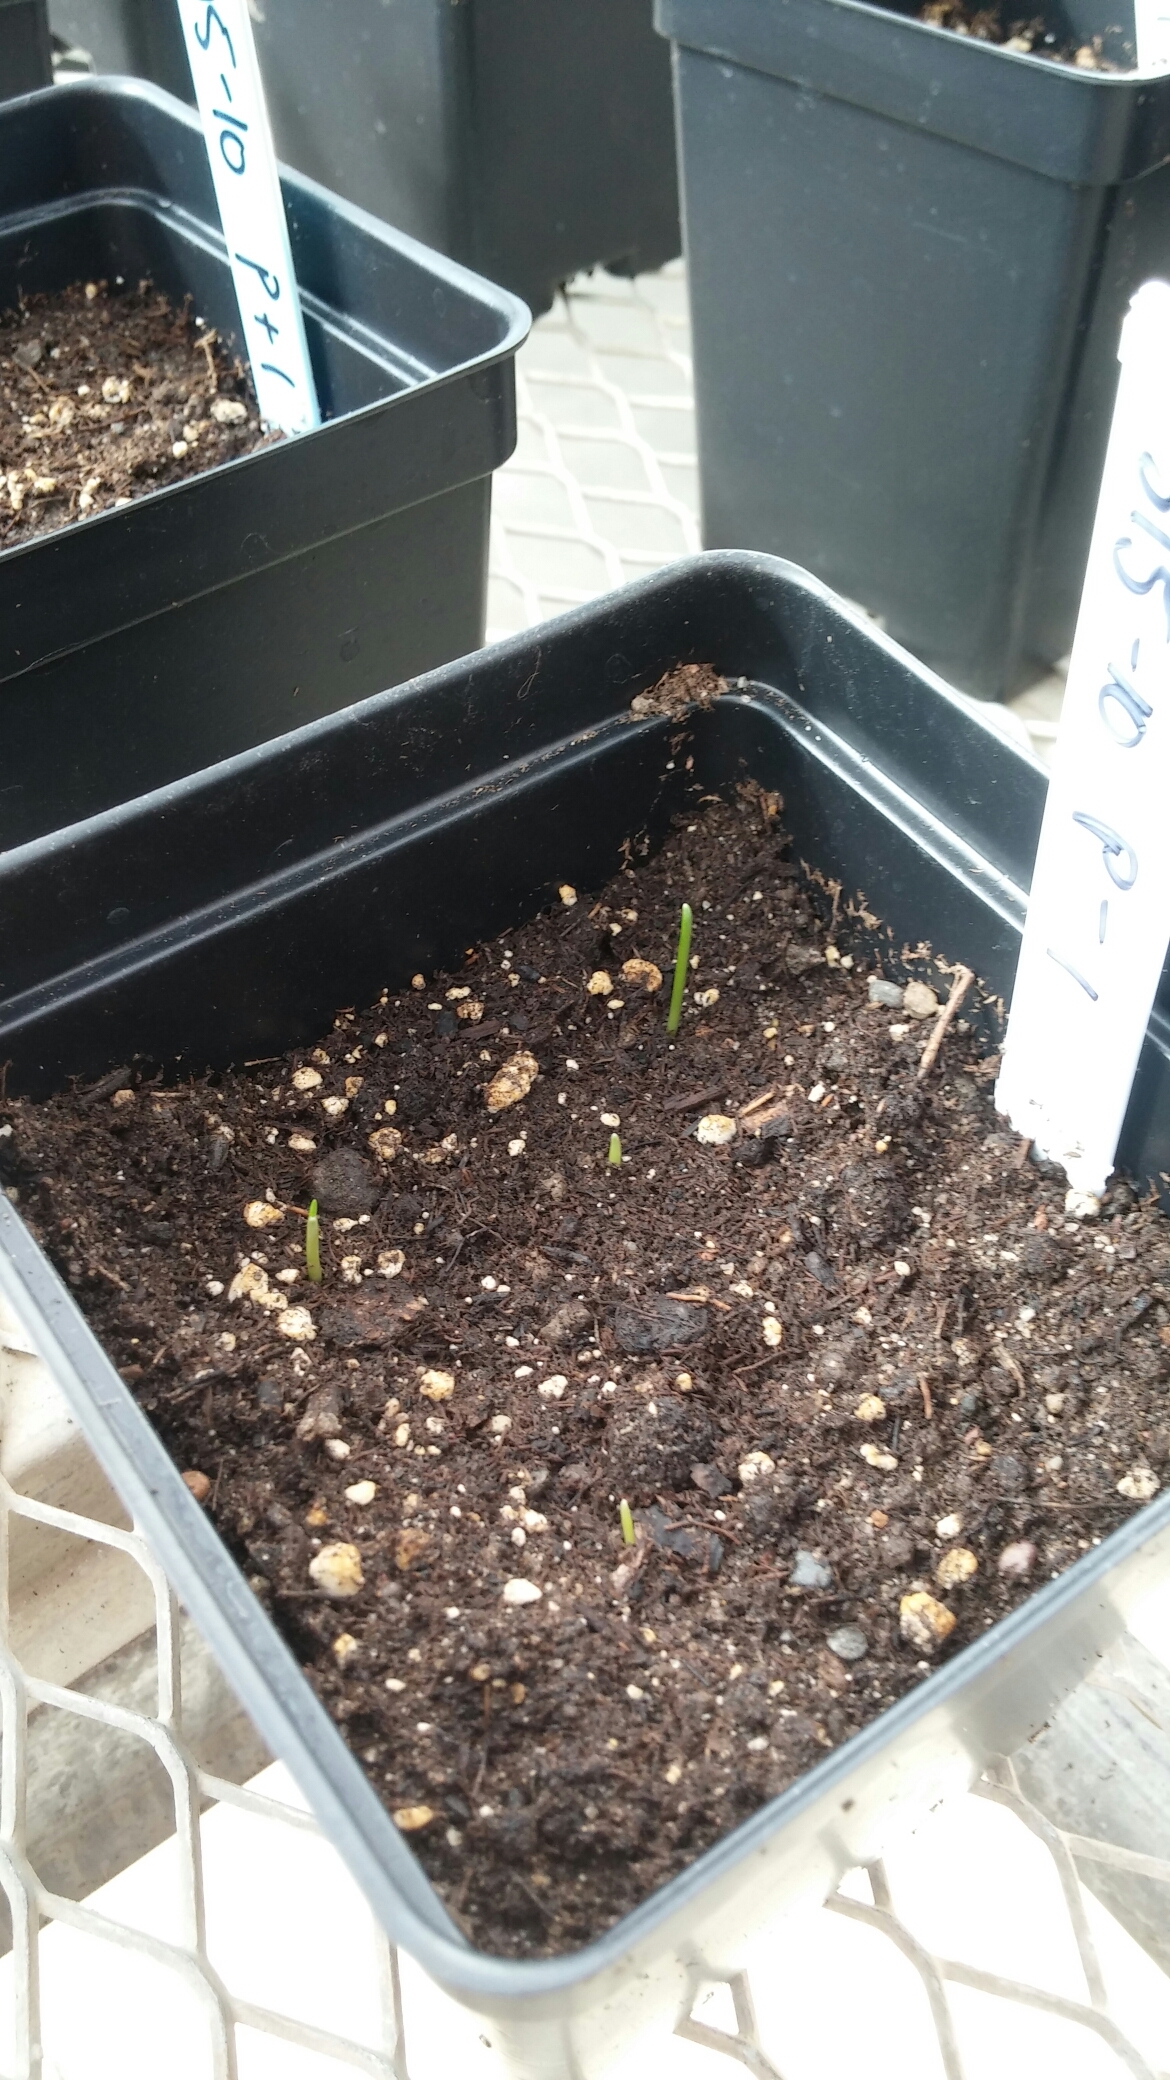
Each pot gets six tiny winter wheat seeds planted.

Trial 1: 216 pots ready to grow!
Stay tuned for more updates and results (eventually) from this and my field study!
Wrapping up summer projects
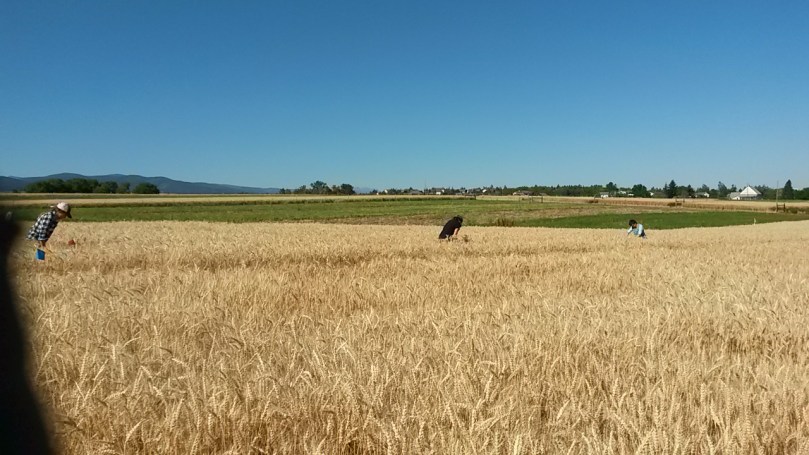
After a hot, dry summer growing season in Montana, the samples have all been collected and the crop harvested for my project investigating wheat production under farming system (organic vs. conventional), climate change (hot or hot and dry), disease (wheat streak virus), and weed competition (cheatgrass) conditions. We collected wheat and weed biomass from every subplot, totaling 108 bags of wheat and an estimated 500 bags of weeds! This will be weighed to determine production, and diversity (number of different weed species) will be assessed.

At the end of July, we also collected our final soil samples, which required over 500 grams of aseptically collected of soil in each subplot. With the extremely dry, clay-containing soil on the farm, this was no quick undertaking, and it took 6-7 lab members a total of 9 hours to collect all 108 samples! Those soil samples will be used for DNA sequencing to determine what microorganisms are present, and compared to other time points to see how they changed over the summer in response to our treatment conditions. The soil will also be measured for essential nutrients, such as nitrogen and carbon content, and saved to be used in a greenhouse experiment to look at the legacy effects of microbial change.
The samples might be collected, but we aren’t done yet. This was year one of a two-year project, and as winter wheat and cheatgrass need to be sown soon, before it gets cold, we have a lot of prep work to do. This includes resetting our data collection tools, including gypsum blocks for soil moisture and ibuttons for soil temperature. We will also need to set up our climate chamber equipment in all new subplots, since we are interested in third-year winter wheat that is part of a five-year crop rotation. We also plan to start a greenhouse experiment looking at the legacy effects of our soil this fall. Not to mention all of data to analyze over the winter months!

ASM Microbe 2016 was a blast!
For the last four days I was in Boston for the American Society for Microbiology (ASM) Microbe 2016 meeting. The meeting is held in Boston on even years, and New Orleans on odd.

The conference brings together all sorts of microbiologists: from earth sciences, to host-associated, to clinical pathologists and epidemiologists, to educators. This year, there were reportedly over 11,000 participants! Because of the wide variety of topics, there is always an interesting lecture going on related to your topic, and it was a wonderful experience to be able to talk directly to other researchers to learn about the clever techniques they are using. I posted about a tiny fraction of those interesting projects on Give Me The Short Version.
On Sunday, I presented a poster on “Farming Systems Modify The Impact Of Inoculum On Soil Microbial Diversity.” I analyzed the data from this project for the Menalled Lab last year, and it has developed into a manuscript in review, as well as several additional projects in development.

One of the best parts of ASM meetings is that you never know who you are going to run into, and I was able to meet up with several friends and colleagues, including Dr. Benoit St-Pierre, who was a post-doc in the Wright lab at the University of Vermont while I was a student, and Laura Cersosimo, the other Ph.D. candidate from the UVM Wright lab who will be defending in just a few months! I also ran into Ph.D. candidate Robert Mugabi, who is hoping to defend by March and in the Barlow lab at UVM while I was there. Most unexpectedly, I ran into a A Lost Microbiologist who had wandered in from Norway: Dr. Nicole Podnecky, who I met at UVM back when we were undergraduates!
Of course, no conference would be complete without vendor swag.

Vendor swag! And not even all of it…

Ice cream made using liquid nitrogen from the Witches of Boston.
What I do for a living Part 1: DNA
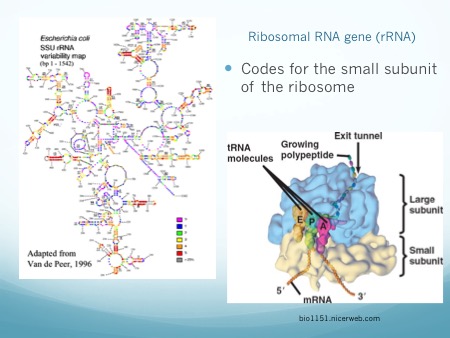
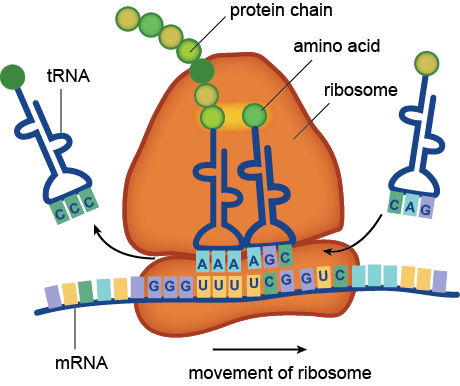
Microbiome studies do not usually employ culturing techniques, and many microorganisms are too recalcitrant to grow in the laboratory. Instead, presumptive identification is made using gene sequence comparisons to known species. The ribosome is an organelle found in all living cells (they are ubiquitous), and it is responsible for translating RNA into amino acid chains. The genes in DNA which encode the parts of the ribosome are great targets for identification-based sequencing. In particular, the small subunit of the ribosome (SSU rRNA) provides a good platform for current molecular methods, although the gene itself does not provide any information about the phenotypic functionality of the organism.

Prokaryotes, such as bacteria and archaea, have a 16S rRNA gene which is approximately 1,600 nucleotide base pairs in length. Eukaryotes, such as protozoa, fungi, plants, animals, etc., have an 18S rRNA gene which is up to 2,300 base pairs in length, depending on the kingdom. In both cases, the 16 or 18 refers to sedimentation rates, and the S stands for Svedberg Units, all-together it is a relative measure of weight and size. Thus, the 18S is larger than the 16S, and would sink faster in water. In both genes, there exist regions which are conserved (identical or near-identical) across taxa, and nine variable regions (V1-V9) [1]. The variable regions are generally found on the exterior of the ribosome, where they are more exposed and prone to higher evolutionary rates. Since the outside of the ribosome is not integral to maintaining its structure, the variable regions are not under functional constraint and may evolve without destroying the ribosome. They provide a means for identification and classification through analysis [2-6]. The conserved areas are targets for primers, as a single primer can bind universally (to all or nearly-all) to its target taxa. The conserved regions are all on the internal structure of the ribosome, and too much change in the sequence will cause its 3D (tertiary) structure to change, thus it won’t be able to interact with the many components in the cell. Mutations or changes in the conserved regions often causes a non-functional ribosome and will kill the cell.

In addition to a small subunit, ribosomes also possess a large subunit (LSU rRNA), the 23S rRNA in prokaryotes, and the 28S rRNA in eukaryotes. Eukaryotes have an additional 5.8S subunit which is non-coding, and all small and large units of RNA have associated proteins which aid in structure and function. Taken together, this gives a combined 70S ribosome in prokaryotes, and a combined 80S ribosome rRNA in eukaryotes.
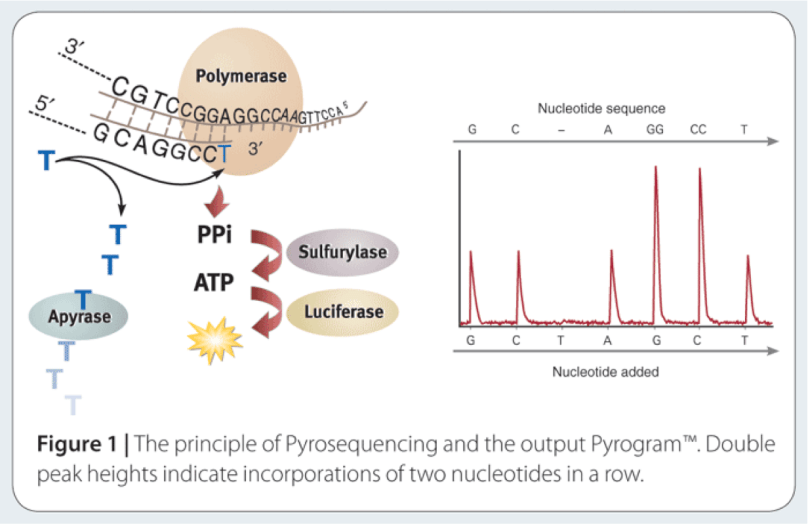
The way to study the rRNA gene is to sequence it. First, you need to extract the DNA from cells, and then you need to make millions of copies of the gene you want using Polymerase Chain Reaction (PCR). PCR and sequencing technology more or less work the same way as a cell would make copies of DNA for cell processes or division (mitosis). You take template DNA, building block nucleotides, and a polymerase enzyme which is responsible for reading the DNA sequence and making an identical copy, and with hours of troubleshooting get a billion copies! Many sequencing machines use nucleotides that have colored dyes attached, and when a nucleotide is added, that dye gets cut (cleaved) off, and the camera can catch and interpret that action. It then records each nucleotide being added to each separate DNA strand, and outputs the sequences for the microorganisms that were in your original sample!
The two main challenges facing high-throughput sequencing are in choosing a target for amplification, and being able to integrate the generated data into an increased understanding of the microbiome of the environment being studied. High-throughput sequencing can currently sequence thousands to millions of reads which are up to 600-1000 bases in length, depending on the platform. This has forced studies to choose which variable regions of the rRNA gene to amplify and sequence, and has opened up an arena for debate on which variable region to choose [2]. And of course, the DNA analysis of all this data you’ve now created is quickly being recognized as the most difficult part- which is what I focused on during my post-doc in the Yeoman Lab. Stay tuned for a blog post on the wonderful world of bioinformatics!
- Neefs J-M, Van de Peer Y, Hendriks L, De Wachter R: Compilation of small ribosomal subunit RNA sequences. Nucleic Acids Res 1990, 18:2237–2318.
- Kim M, Morrison M, Yu Z: Evaluation of different partial 16S rRNA gene sequence regions for phylogenetic analysis of microbiomes. J Microbiol Methods 2010, 84:81–87.
- Doud MS, Light M, Gonzalez G, Narasimhan G, Mathee K: Combination of 16S rRNA variable regions provides a detailed analysis of bacterial community dynamics in the lungs of cystic fibrosis patients. Hum. Genomics 2010, 4:147–169.
- Yu Z, Morrison M: Comparisons of different hypervariable regions of rrs genes for use in fingerprinting of microbial communities by PCR-denaturing gradient gel electrophoresis. Appl Env Microbiol 2004, 70:4800–4806.
- Lane DJ, Pace B, Olsen GJ, Stahl DA, Sogin ML, Pace NR: Rapid determination of 16S ribosomal RNA sequences for phylogenetic analyses. Proc Natl Acad Sci USA 1985, 82:6955–6959.
- Yu Z, García-González R, Schanbacher FL, Morrison M: Evaluations of different hypervariable regions of archaeal 16S rRNA genes in profiling of methanogens by archaea-specific PCR and denaturing gradient gel electrophoresis. Appl Env Microbiol 2007, 74:889–893.
