In October 2017, Dr. Rich Corsi came to visit Oregon for two weeks during a sabbatical from the University of Texas, Austin. During his stay, Rich and I, and other BioBE/ESBL researchers chatted about doing a pilot study that would bring UT’s indoor chemistry work together with BioBE’s indoor microbial work.
Since we began our collaboration in the fall of 2017, only one of the research team is still in their original position (Jeff Kline at ESBL)! Rich Corsi, Ying Xu, and myself have all gone on to faculty positions elsewhere, graduate student Chenyang Bi defended and started a post-doc position, and the two undergrads working with me, Susie Nunez and Samantha Velazquez, graduated and went on to other things! Science collaborations work best when they can stand the test of time and geography. The benefit to everyone moving around is that you are able to hold collaboration meetings in new and exciting places each time.
#HOMEChem Open House @UTAustin was awesome! Some really exciting #indoorchem research was presented, and it was a great opportunity to start planning new projects!! Thanks for showing us around! pic.twitter.com/kTC5Te64ib
Samantha Velazquez1,
Chenyang Bi 2,3, Jeff Kline 1,4, Susie Nunez1,
Richard Corsi 3,5, Ying Xu 3,6, Suzanne L. Ishaq1,7*
Affiliations:
1 Biology and
the Built Environment Center, University
of Oregon, Eugene, OR, 97403
2 Department
of Civil Environmental Engineering, Virginia Polytechnic Institute and State University,
Blacksburg, VA 24061 (current)
3 Department
of Civil, Architectural and Environmental Engineering, University of Texas,
Austin, TX 78712
4 Energy
Studies and Buildings Laboratory, University of Oregon, Eugene, OR, 97403
5 Fariborz
Maseeh College of Engineering and Computer Science, Portland State University,
Portland, OR 97207 (current)
6 Department of Building Science, Tsinghua University,
100084, Beijing, P. R. China (current)
7 School of Food and Agriculture, University of Maine, Orono, ME 04469 (current)
Abstract
Di-2-ethylhexyl
phthalate (DEHP) is a plasticizer used in consumer products and building
materials, including polyvinyl chloride flooring material. DEHP adsorbs from
material and leaches into soil, water, or dust, and presents an exposure risk
to building occupants by inhalation, ingestion, or absorption. A number of bacterial isolates are
demonstrated to degrade DEHP in culture, but bacteria may be susceptible to it
as well, thus this study examined the relation of DEHP to bacterial communities
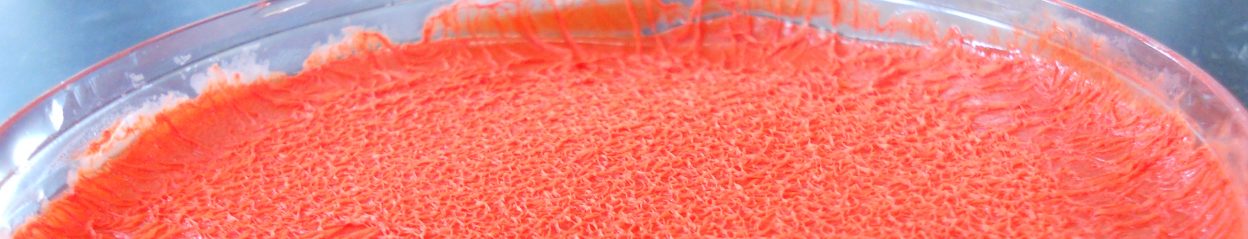
in dust. Polyvinyl chloride flooring was
seeded with homogenized house dust and incubated for up to 14 days, and
bacterial communities in dust were identified at days 1, 7, and 14 using the
V3-V4 regions of the bacterial 16S rRNA gene.
DEHP concentration in dust increased over time, as expected, and
bacterial richness and Shannon diversity were negatively correlated with DEHP
concentration. Some
sequence variants of Bacillus, Corynebacterium jeddahense, Streptococcus, and Peptoniphilus were relatively more abundant at low concentrations
of DEHP, while some Sphingomonas, Chryseobacterium, and a member of the
Enterobacteriaceae family were relatively more abundant at higher
concentrations. The built environment is
known to host lower microbial diversity and biomass than natural environments,
and DEHP or other chemicals indoors may contribute to this paucity.
The review on health in the built environment, led by undergrad (now post-bac) Patrick Horve and which I acted as managing author, is available online here, and an open-access, view-only version is available here. It’s part of the Healthy Building special issue from the Journal of Exposure Science & Environmental Epidemiology.
Building upon current knowledge and techniques of indoor microbiology to construct the next era of theory into microorganisms, health, and the built environment. Patrick F. Horve, Savanna Lloyd, Gwynne A. Mhuireach, Leslie Dietz, Mark Fretz, Georgia MacCrone, Kevin Van Den Wymelenberg & Suzanne L. Ishaq. Journal of Exposure Science & Environmental Epidemiology (2019)
Abstract
In the constructed habitat in which we spend up to 90% of our time, architectural design influences occupants’ behavioral patterns, interactions with objects, surfaces, rituals, the outside environment, and each other. Within this built environment, human behavior and building design contribute to the accrual and dispersal of microorganisms; it is a collection of fomites that transfer microorganisms; reservoirs that collect biomass; structures that induce human or air movement patterns; and space types that encourage proximity or isolation between humans whose personal microbial clouds disperse cells into buildings. There have been recent calls to incorporate building microbiology into occupant health and exposure research and standards, yet the built environment is largely viewed as a repository for microorganisms which are to be eliminated, instead of a habitat which is inexorably linked to the microbial influences of building inhabitants. Health sectors have re-evaluated the role of microorganisms in health, incorporating microorganisms into prevention and treatment protocols, yet no paradigm shift has occurred with respect to microbiology of the built environment, despite calls to do so. Technological and logistical constraints often preclude our ability to link health outcomes to indoor microbiology, yet sufficient study exists to inform the theory and implementation of the next era of research and intervention in the built environment. This review presents built environment characteristics in relation to human health and disease, explores some of the current experimental strategies and interventions which explore health in the built environment, and discusses an emerging model for fostering indoor microbiology rather than fearing it.
Update: on the very last day of June, I received word that two more papers had been accepted for publication, bringing the tally to five in the month of June alone!
I’ve previously discussed how many researchers end up with partially-completed projects in their wake, and I’ve made a concerted effort in the last 6-ish months to get mine across the finish line. I have five new publications which were accepted in June alone, with one reviews and one manuscript currently in review, and another three manuscripts in preparation. On top of that, I have a number of publications that are looming in the second half of 2019.
Ishaq, S.L., Lachman, M.M., Wenner, B.A., Baeza, A., Butler, M., Gates, E., Olivo, S., Buono Geddes, J., Hatfield, P., Yeoman, C.J. 2019. Pelleted-hay alfalfa feed increases sheep wether weight gain and rumen bacterial richness over loose-hay alfalfa feed. PLoS ONE 14(6): e0215797. Article.
I’ve already done the blog post and project page for the ‘particle size’ paper, so I’ll move on.
Stenson, J., Ishaq, S.L., Laguerre, A., Loia, A., MacCrone, G., Mugabo, I., Northcutt, D., Riggio, M., Barbosa, A., Gall, E.T., Van Den Wymelenberg, K. 2019. Monitored Indoor Environmental Quality of a Mass Timber Office Building: A Case Study. Buildings 9:142. Article.
This was a case study on a newly (at the time of sample collection) constructed building in Portland, OR which was made using mass timber framing. Since building materials alter the sound, vibration, smell, and air quality of a building, the primary goals of the study were to evaluate occupant experience and indoor air quality. Dust samples were also collected to investigate the indoor bacterial community, as the effect of building materials on the whole microbial community indoors is unknown. For this project, I assisted with microbial sample processing and analysis, for which I taught Georgia MacCrone, an undergraduate Biology/Ecology junior at UO, bioinformatics and DNA sequence analysis.
Garcia-Mazcorro, J.F., Ishaq, S.L., Rodriguez-Herrera, M.V., Garcia-Hernandez, C.A., Kawas, J.R., Nagaraja, T.G. 2019. Review: Are there indigenous Saccharomyces in the digestive tract of livestock animal species? Implications for health, nutrition and productivity traits. Animal. Accepted.
This review was a pleasure to work on. Last year, Dr. Jose Garcia-Mazcorro emailed me, as I am the corresponding author on a paper investigating protozoa and fungi in cows with acidosis. We corresponded about fungi in the rumen, probiotics, and diet, and Jose graciously invited me to contribute to the review. Last August, after having worked with Jose for months, we finally met in person in Leipzig, Germany at ISME. Since then, we’ve been discussion possible collaborations on diet, probiotics, and the gut microbiome.
Horve, P.F., Lloyd, S., Mhuireach, G.A., Dietz, L., Fretz, M., MacCrone, G., Van Den Wymelenberg, K., Ishaq, S.L. Building Upon Current Knowledge of Indoor Microbiology to Construct the Next Era of Research into Microorganisms, Health, and the Built Environment. Journal of Exposure Science and Environmental Epidemiology. Accepted.
Seipel, T., Ishaq, S.L., Menalled, F.D. Agroecosystem resilience is modified by management system via plant–soil feedbacks. Basic and Applied Ecology. Accepted.
And as a reminder, I’m a guest editor for the PLoS ” Microbiome Across Biological Systems” special issue call, which is accepting submissions into August!
Sequence data contamination from biological or digital sources can obscure true results and falsely raise one’s hopes. Contamination is a persist issue in microbial ecology, and each experiment faces unique challenges from a myriad of sources, which I have previously discussed. In microbiology, those microscopic stowaways and spurious sequencing errors can be difficult to identify as non-sample contaminants, and collectively they can create large-scale changes to what you think a microbial community looks like.
Samples from large studies are often processed in batches based on how many samples can be processed by certain laboratory equipment, and if these span multiple bottles of reagents, or water-filtration systems, each batch might end up with a unique contamination profile. If your samples are not randomized between batches, and each batch ends up representing a specific time point or a treatment from your experiment, these batch effects can be mistaken for a treatment effect (a.k.a. a false positive).
Due to the high cost of sequencing, and the technical and analytical artistry required for contamination identification and removal, batch effects have long plagued molecular biology and genetics. Only recently have the pathologies of batch effects been revealed in a harsher light, thanks to more sophisticated analysis techniques (examples here and here and here) and projects dedicated to tracking contamination through a laboratory pipeline. To further complicate the issue, sources of and practical responses to contamination in fungal data sets is quite different than that of bacterial data sets.
Chapter 1
“The times were statistically greater than prior time periods, while simultaneously being statistically lesser to prior times, according to longitudinal analysis.”
Over the past year, I analyzed a particularly complex bacterial 16S rRNA gene sequence data set, comprising nearly 600 home dust samples, and about 90 controls. Samples were collected from three climate regions in Oregon, over a span of one year, in which homes were sampled before and approximately six weeks after a home-specific weatherization improvement (treatment homes) or simply six weeks later in (comparison) homes which were eligible for weatherization but did not receive it. As these samples were collected over a span of a year, they were extracted with two different sequencing kits and multiple DNA extraction batches, although all within a short time after collection. The extracted DNA was spread across two sequence runs to allow for data processing to begin on cohort 1, while we waited for cohort 2 homes to be weatherized. Thus, there were a lot of opportunities to introduce technical error or biological contamination that could be conflated with treatment effects.
On top of this, each home was unique, with it’s own human and animal occupants, architectural and interior design, plants, compost, and quirks, and we didn’t ask homeowners to modify their behavior in any way. This was important, as it meant each of the homes – and their microbiomes – are somewhat unique. Therefore I didn’t want to remove sequences which might be contaminants on the basis of low abundance and risk removing microbial community members which were specific to that home. After the typical quality assurance steps to curate and process the data, which can be found on GitHub as an R script of a DADA2 package workflow, I needed to decide what to do with the negative controls.
Because sequencing is expensive, most of the time there is only one negative control included in sequencing library preparation, if that. The negative control is a blank sample – just water, or an unused swab – which does not intentionally contain cells or nucleic acids. Thus anything you find there will have come from contamination. The negative control can be used to normalize the relative abundance numbers – if you find 1,000 sequences in the negative control, which is supposed to have no DNA in it, then you might only continue looking at samples with a certain amount higher than 1,000 sequences. This risks throwing out valid sequences that happen to be rare. Alternatively, you can try to identify the contaminants and remove whole taxa from your data set, risking the complete removal of valid taxa.
I had three types of negative controls: sterile DNA swabs which were processed to check for biological contamination in collection materials, kit controls where a blank extraction was run for each batch of extractions to test for biological contamination in extraction reagents, and PCR negative controls to check for DNA contamination of PCR reagents. In total, 90 control samples were sequenced, giving me unprecedented resolution to deal with contamination. Looking at the total number of sequences before and after my quality-analysis processing, I can see that the number of sequences in my negative controls reduces dramatically; they were low-quality in some way and might be sequencing artifacts. But, an unsatisfactory number remain after QA filtering; these are high-quality and likely come from microbial contamination.
This slideshow requires JavaScript.
I wasn’t sure how I wanted to deal with each type of control. I came up with three approaches, and then looked at unweighted, non-rarefied ordination plots (PCoA) to watch how my axes changed based on important components (factors). What follows is a narrative summarize of what I did, but I included the R script of my phyloseq package workflow and workaround on GitHub.
Chapter 2
“In microbial ecology, preprints are posted on late November nights. The foreboding atmosphere of conflated factors makes everyone uneasy.”
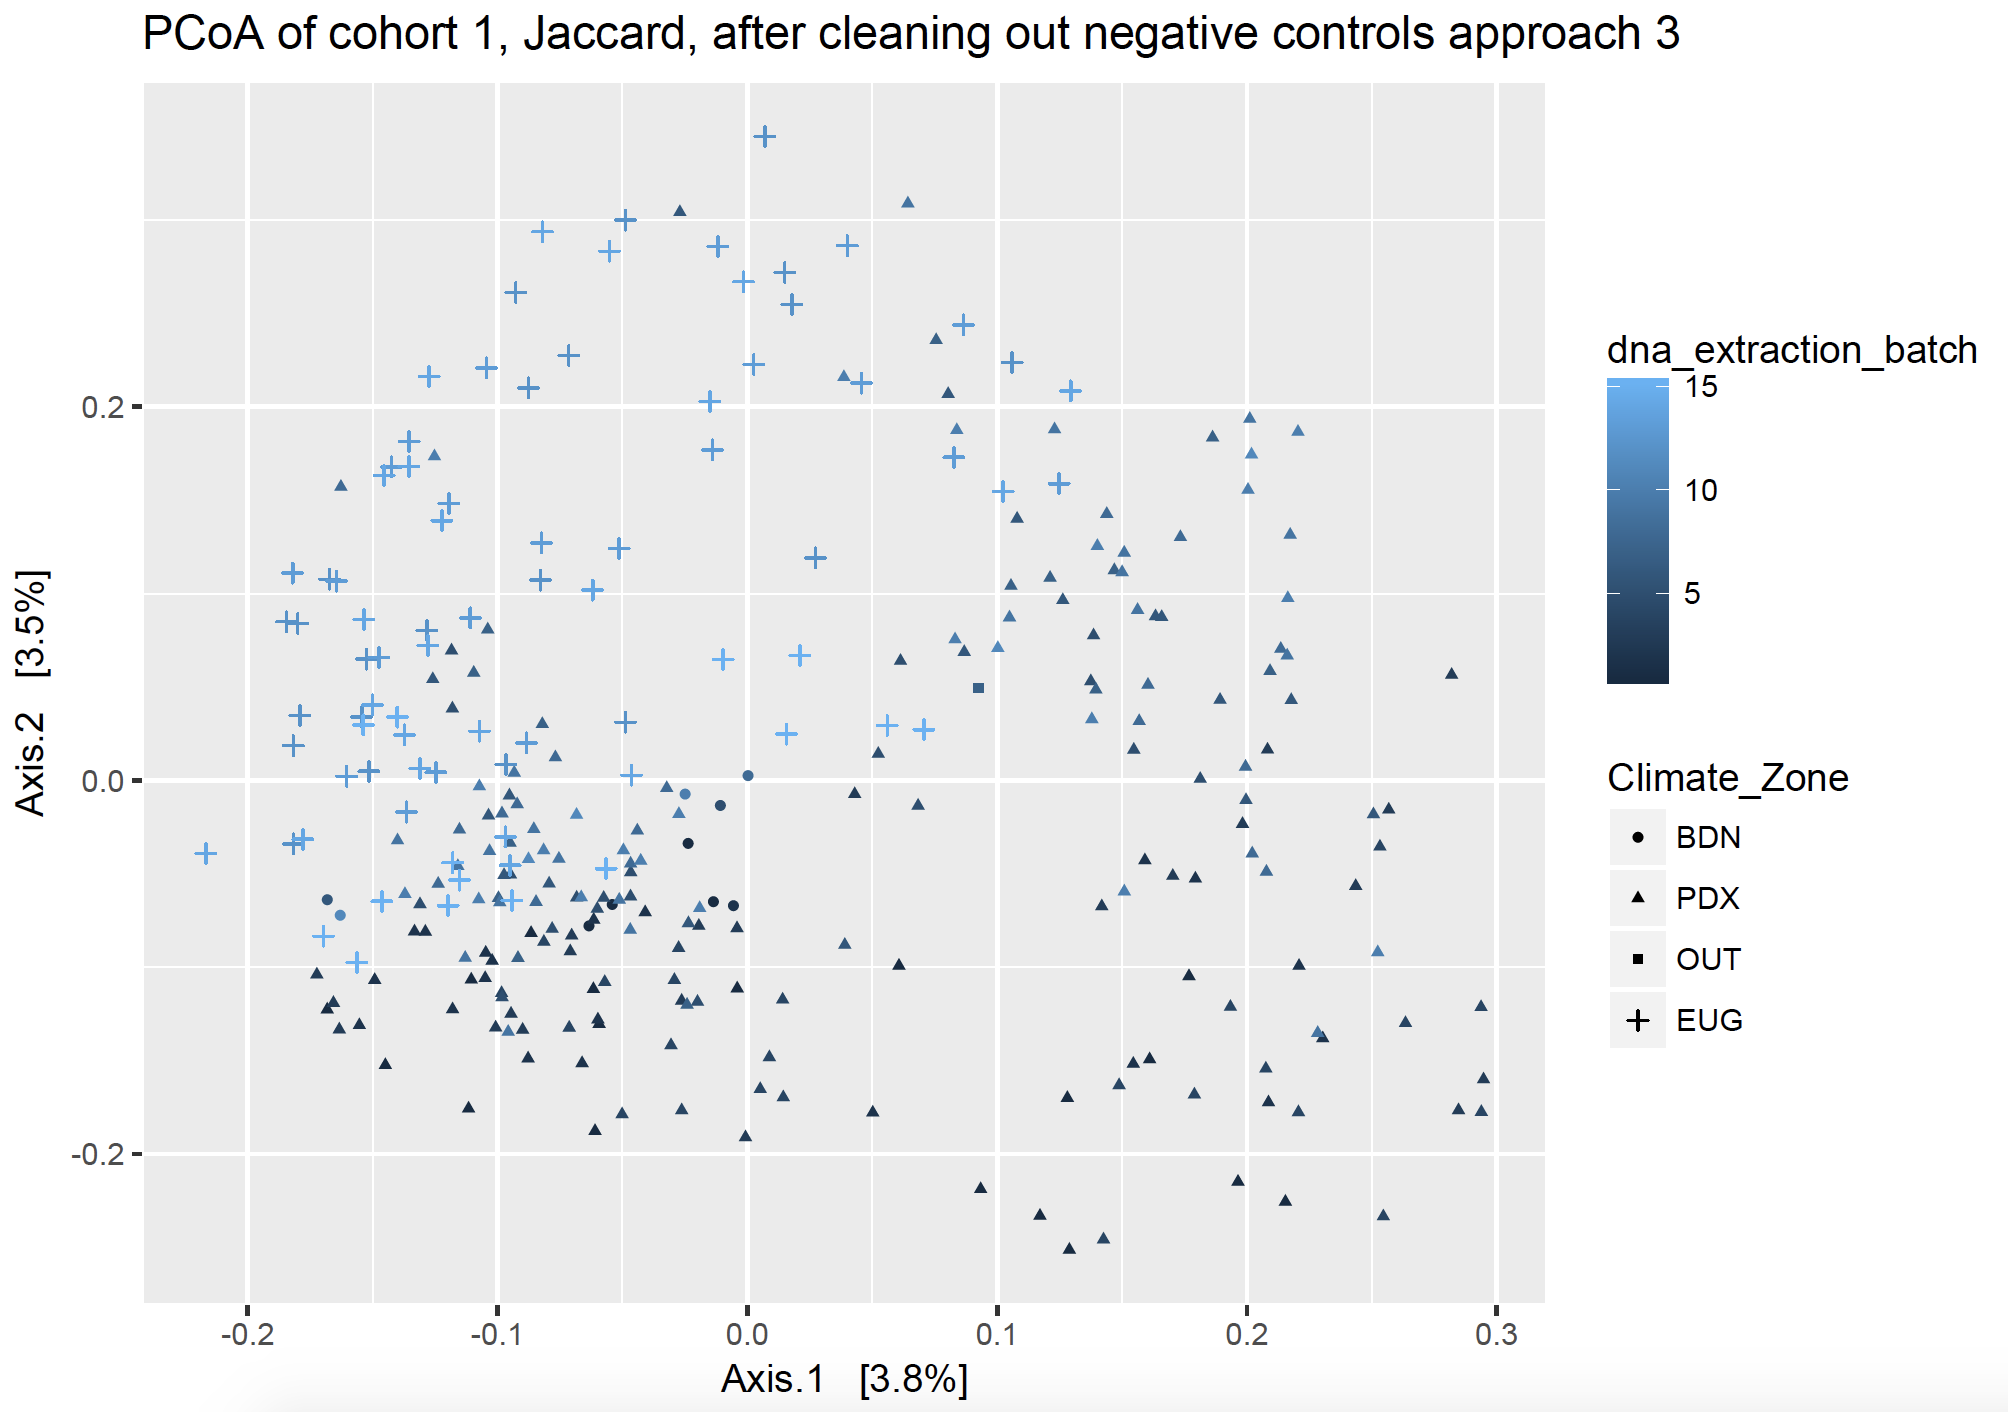
Ordination plots visualize lots of complex communities together. In both ordination figures below, each point on the graph represents a dust sample from one house. They are clustered by community distance: those closer together on the plot have a more similar community than points which are further away from each other. The points are shaped by the location of the samples, including Bend, Eugene, Portland, along with a few pilot samples labeled “Out”, and negative controls which have no location (not pictured but listed as NA). The points are colored by DNA extraction b
Figure 1 Ordination of home samples prior to removing contaminants found in negative controls.
In Figure 1, the primary axis (axis 1) shows a clear clustering of samples by DNA extraction batch, but this is also mixed with geographic location, and as it turns out – date of collection and sequencing run. We know from other studies that geographic location, date of collection, and sequencing batch can all affect the microbial community.
Approach 1: Subtraction + outright removal
This approach subsets my data into DNA extraction batches, and then uses the number of sequences found in the negative controls to subtract out sequences from my dust samples. This assumes that if a particular sequence showed up 10 times in my negative control, but 50 times in my dust samples, that only 40 of those in my dust sample were real. For each of my DNA extraction batch negative control samples, I obtained the sum of each potential contaminant that I found there, and then subtracted those sums from the same sequence columns in my dust samples.
Figure 2 Ordination of home samples after removing contaminants found in negative controls, particular to each batch, using approach 1.
Approach 1 was alright, but there was still an effect of DNA extraction batch (indicated by color scale) that was stronger than location or treatment (not included on this graph). This approach is also more pertinent for working with OTUs, or situations where you wouldn’t want to remove the whole OTU, just subtract out a certain number sequences from specific columns. There is currently no way to do that just from phyloseq, so I made a work-around (see the GitHub page). However, using DADA2 gives you Sequence Variants, which are more precise and I found it’s better to remove them with approach 3.
Approach 2: Total Removal
This approach removes any contaminant sequences that is found in ANY of the negative controls from ALL the house samples, regardless of which negative control was for which extraction batch. This approach assumes that if it a sequence was found as a contaminant in a negative control somewhere, that it is a contaminant everywhere.
Figure 3 Ordination of home samples after removing contaminants found in negative controls, particular to each batch, using approach 2.
Once again, approach 2 was alright, and now that primary axis (axis 1) of potential batch effect is now my secondary axis; so there is still an effect of DNA extraction batch (indicated by color scale) but it is weaker. When I recolor by different variables, there is much more clustering by Treatment than by any batch effects. However, that second axis is also one of my time variables, so don’t want to get rid of all of the variation on that axis. But, since my negative kit controls showed a lot of variation in number and types of taxa, I don’t want to remove everything found there from all samples indiscriminately.
Additionally, I don’t favor throwing sequences out just because they were a contaminant somewhere, particularly for dust samples. Contamination can be situational, particularly if a microbe is found in the local air or water supply and would be legitimately found in house dust but would have also accidentally gotten into the extraction process.
Approach 3: “To each its own”
This approach removes all the sequences from PCR and swab contaminant SVs fully from each cohort, respectively, and removes extraction kit contaminants fully from each DNA extraction batch, respectively. I took all the sequences of the SVs found in my dust samples and made them into a vector (list), and then I took all the sequences of the SVs found in my controls and made them into a different vector. I effectively subtracted out the contaminant SVs by name, but asking to find the sequences which were different between my two lists (thus returning the sequences which were in my dust samples but not in my control samples). I did this respective to each sequencing cohort and batch, so that I only remove the pertinent sequences (ex. using kit control 1 to subtract from DNA extraction batch 1).
Figure 4 Ordination of home samples after removing contaminants found in negative controls, particular to each batch, using approach 3.
In Figure 4, potential batch effect is solidly my secondary axis and not the primary driving force behind clustering. The primary axis (axis 1) shows a clear separation by climate zone, or location of homes, once the batch contamination has been removed. When I recolor by different variables, there is much more clustering by Treatment and almost none by batch effects. I say almost none, because some of my DNA extraction batches also happen to be Treatment batches, as they represent a subset of samples from a different location. Thus, I can’t tell if those samples cluster separately solely because of location or also because of batch effect. However, I am satisfied with the results and ready to move on.
Unlike its namesake, this tale has a happier ending.
Last June, I started a position as a Research Assistant Professor of Microbial Ecology at the Biology and the Built Environment Center at the University of Oregon. The BioBE Center is a collaborative, interdisciplinary research team investigating the built environment – the ecosystem that humans have created for themselves in buildings, vehicles, roadways, cities, etc. With my background in host-associated microbiology, I am concerned with how the built environment interacts with biology.
In addition to knowing how our presence, our behaviors (ex. cleaning), and how we run our buildings (ex. ventilation) creates the indoor microbiome, I want to know how the indoor microbiome affects us back. Not only can “sick buildings” negatively affect air quality, but they can harbor more microorganisms, especially fungi, or pathogenic species which are detrimental to our health.
My first indoor microbiome data is one that I have inherited from an ongoing project on weatherization in homes, and hope to present some of that work at conferences this summer. Since June, a large amount of my time has gone into project development and grant writing, most of which is still pending, so stay tuned for details. It has involved read lots of articles, going to seminars, networking, and brainstorming with some brilliant researchers.
As research faculty, I am not required to teach, although I have the option to propose and teach courses by adjusting my percent effort (I would use the teaching salary to “buy back” some research salary). As I am not currently tenure-track, I am also limited in my ability to hire and formally mentor students. However, I have been teaching bioinformatics to a student who recently graduated with his bachelor’s and is pursuing a masters in bioinformatics later this year.
I’ve also been keeping up with my science outreach. I gave a presentation on my host-associated microbiome work, I marched, I volunteered for a few hours at Meet A Scientist day at the Eugene Science Center, and I’m hosting a Science Pub on “A crash course in the microbiome of the digestive tract” at Whirled Pies in Eugene this Thursday, February 8th!