Several years ago, during my Ph.D. at the University of Vermont, I provided wet-lab and DNA sequence analysis work for a project investigating the health effects of a low or high fat diet on mice with Dr. Huawei Zeng of the USDA Agricultural Research Service. It was just recently published in the Journal of Nutritional Biochemistry!
Abstract
Consumption of an obesigenic/high-fat diet (HFD) is associated with a high colon cancer risk and may alter the gut microbiota. To test the hypothesis that long-term high-fat (HF) feeding accelerates inflammatory process and changes gut microbiome composition, C57BL/6 mice were fed HFD (45% energy) or a low-fat (LF) diet (10% energy) for 36 weeks. At the end of the study, body weights in the HF group were 35% greater than those in the LF group. These changes were associated with dramatic increases in body fat composition, inflammatory cell infiltration, inducible nitric oxide synthase protein concentration and cell proliferation marker (Ki67) in ileum and colon. Similarly, β-catenin expression was increased in colon (but not ileum). Consistent with gut inflammation phenotype, we also found that plasma leptin, interleukin 6 and tumor necrosis factor α concentrations were also elevated in mice fed the HFD, indicative of chronic inflammation. Fecal DNA was extracted and the V1–V3 hypervariable region of the microbial 16S rRNA gene was amplified using primers suitable for 454 pyrosequencing. Compared to the LF group, the HF group had high proportions of bacteria from the family Lachnospiraceae/Streptococcaceae, which is known to be involved in the development of metabolic disorders, diabetes and colon cancer. Taken together, our data demonstrate, for the first time, that long-term HF consumption not only increases inflammatory status but also accompanies an increase of colonic β-catenin signaling and Lachnospiraceae/Streptococcaceae bacteria in the hind gut of C57BL/6 mice.
For the last four days I was in Boston for the American Society for Microbiology (ASM) Microbe 2016 meeting.The meeting is held in Boston on even years, and New Orleans on odd.
The conference brings together all sorts of microbiologists: from earth sciences, to host-associated, to clinical pathologists and epidemiologists, to educators. This year, there were reportedly over 11,000 participants! Because of the wide variety of topics, there is always an interesting lecture going on related to your topic, and it was a wonderful experience to be able to talk directly to other researchers to learn about the clever techniques they are using. I posted about a tiny fraction of those interesting projects on Give Me The Short Version.
On Sunday, I presented a poster on “Farming Systems Modify The Impact Of Inoculum On Soil Microbial Diversity.” I analyzed the data from this project for the Menalled Lab last year, and it has developed into a manuscript in review, as well as several additional projects in development.
One of the best parts of ASM meetings is that you never know who you are going to run into, and I was able to meet up with several friends and colleagues, including Dr. Benoit St-Pierre, who was a post-doc in the Wright lab at the University of Vermont while I was a student, and Laura Cersosimo, the other Ph.D. candidate from the UVM Wright lab who will be defending in just a few months! I also ran into Ph.D. candidate Robert Mugabi, who is hoping to defend by March and in the Barlow lab at UVM while I was there. Most unexpectedly, I ran into a A Lost Microbiologist who had wandered in from Norway: Dr. Nicole Podnecky, who I met at UVM back when we were undergraduates!
This slideshow requires JavaScript.
Of course, no conference would be complete without vendor swag.
Vendor swag! And not even all of it…
Ice cream made using liquid nitrogen from the Witches of Boston.
Today I’ll be presenting a poster on “Farming Systems Modify The Impact Of Inoculum On Soil Microbial Diversity.” at the American Society for Microbiology (ASM) Microbe 2016 meeting.
Come find me in the poster hall from 12:30 pm to 2:30 pm, poster number SUNDAY-053.
Stay tuned for the electronic poster, which will be uploaded after my presentation (as per ASM regulations).
Bioinformatics brings statistics, mathematics, and computer programming to biology and other sciences. In my area, it allows for the analysis of massive amounts of genomic (DNA), transcriptomic (RNA), proteomic (proteins), or metabolomic (metabolites) data.
In recent years, the advances in sequencing have allowed for the large-scale investigation of a variety of microbiomes. Microbiome refers to the collective genetic material or genomes of all the microorganisms in a specific environment, such as the digestive tract or the elbow. The term microbiome is often casually thrown around: some people mistakenly use it interchangeably with “microbiota”, or use it to describe only the genetic material of a specific type of microorganism (i.e. “microbiome” instead of “bacterial microbiome”). Not only have targeted, or amplicon sequencing techniques improved, but methods that use single or multiple whole genomes have become much more efficient. In both cases, this has resulted in more sequences being amplified more times. This creates “sequencing depth”, a.k.a. better “coverage”: if you can sequence one piece of DNA 10 times instead of just once of twice, then you can determine if changes in the sequence are random errors or really there. Unfortunately, faster sequencing techniques usually have more spontaneous errors, so your data are “messy” and harder to deal with. More and messier data creates the problem of handling data.
The grey lines on the right represent sequence pieces reassembled into a genome, with white showing gaps. The colored lines represent a nucleotide that is different from the reference genome, usually just a random error in one sequence. The red bar shows where each sequence has a nucleotide different from that of the reference genome, indicating that this bacterial strain really is different there. This is a single nucleotide polymorphism (SNP).
DNA analysis requires very complex mathematical equations in order to have a standardized way to quantitatively and statistically compare two or two million DNA sequences. For example, you can use equations for estimating entropy (chaos) and estimate how many sequences you might be missing due to sequencing shortcomings based on how homogeneous (similar) or varied your dataset is. If you look at your data in chunks of 100 sequences, and 90 of them are different from each other, then sequencing your dataset again will probably turn up something new. But if 90 are the same, you have likely found nearly all the species in that sample.
Bioinformatics takes these complex equations and uses computer programs to break them down into many simple pieces and automate them. However, the more data you have, the more equations the computer will need to do, and the larger your files will be. Thus, many researchers are limited by how much data they can process.
Mr. DNA, Jurassic Park (1993)
There are several challenges to analyzing any dataset. The first is assembly.
Sequencing technology can only add so many nucleotide bases to a synthesized sequence before it starts introducing more and more errors, or just stops adding altogether. To combat this increase in errors, DNA or RNA is cut into small fragments, or primers are used to amplify only certain small regions. These pieces can be sequenced from one end to another, or can be sequenced starting at both ends and working towards the middle to create a region of overlap. In that case, to assemble, the computer needs to match up both ends and create one contiguous segment (“contig”). With some platforms, like Illumina, the computer tags each sequence by where on the plate it was, so it knows which forward piece matches which reverse.
When sequencing an entire genome (or many), the pieces are enzymatically cut, or sheared by vibrating them at a certain frequency, and all the pieces are sequenced multiple times. The computer then needs to match the ends up using short pieces of overlap. This can be very resource-intensive for the computer, depending on how many pieces you need to put back together, and whether you have a reference genome for it to use (like the picture on a puzzle box), or whether you are doing it de novo from scratch (putting together a puzzle without a picture, by trial and error, two pieces at a time).
Once assembled into their respective consensus sequences, you need to quality-check the data.
This can take a significant amount of time, depending on how you go about it. It also requires good judgement, and a willingness to re-run the steps with different parameters to see what will happen. An easy and quick way is to have the computer throw out any data below a certain threshold: longer or shorter than what your target sequence length was, ambiguous bases (N) which the computer couldn’t call as a primary nucleotide (A, T, C, or G), or the confidence level (quality score) of the base call was low. These scores are generated by the sequencing machine as a relative measure of how “confident” the base call is, and this roughly translates to potential number of base call errors (ex. marking it an A instead of a T) per 1,000 bases. You can also cut off low-quality pieces, like the very beginning or ends of sequences which tend to sequence poorly and have low quality. This is a great example of where judgement is needed: if you quality-check and trim off low quality bases first, and then assemble, you are likely to have cut off the overlapping ends which end up in the middle of a contig and won’t be able to put the two halves together. If you assemble first, you might end up with a sequence that is low-quality in the middle, or very short if you trim it on the low quality portions. If your run did not sequence well and you have lot of spontaneous errors, you will have to decide whether to work with a lot of poor-quality data, or a small amount of good-quality data leftover after you trim out the rest, or spend the money to try and re-sequence.
There are several steps that I like to add, some of which are necessary and some which are technically optional. One of them is to look for chimeras, which are two sequence pieces that mistakenly got joined together. This happens during the PCR amplification step, often if there is an inconsistent electrical current or other technical problem with the machine. While time- and processor-consuming, chimera checking can remove these fake sequences before you accidentally think you’ve discovered a new species. Your screen might end up looking something like this…
Actual and common screen-shot… but I am familiar enough with it to be able to interpret!
Eventually, you can taxonomically and statistically assess your data.
Ishaq and Wright, 2014, Microbial Ecology
In order to assign taxonomic identification (ex. genus or species) to a sequence, you need to have a reference database. This is a list of sequences labelled with their taxonomy (ex. Bacillus licheniformis), so that you can match your sequences to the reference and identify what you have. There are several pre-made ones publicly available, but in many cases you need to add to or edit these, and several times I have made my own using available data in online databases.
Ishaq and Wright, 2014, Microbial Ecology
You can also statistically compare your samples. This can get complicated, but in essence tries to mathematically compare datasets to determine if they are actually different, and if that difference could have happened by chance or not. You can determine if organically-farmed soil contains more diversity than conventionally-farmed soils. Or whether you have enough sequencing coverage, or need to go back and do another run. You can also see trends across the data, for example, whether moose from different geographic locations have similar bacterial diversity to each other (left). Or whether certain species or environmental factors have a positive/negative/ or no correlation (below).
Bioinformatics can be complicated and frustrating, especially because computers are very literal machines and need to have things written in very specific ways to get them to accomplish tasks. They also aren’t very good at telling you what you are doing wrong; sometimes it’s as simple as having a space where it’s not supposed to be. It takes dedication and patience to go back through code to look for minute errors, or to backtrack in an analysis and figure out at which step several thousand sequences disappeared and why. Like any skill, computer science and bioinformatics take time and practice to master. In the end, the interpretation of the data and identifying trends can be really interesting, and it’s really rewarding when you finally manage to get your statistical program to create a particularly complicated graph!
Stay tuned for an in-depth look at my current post-doctoral work with weed management in agriculture and soil microbial diversity!
A manuscript that I helped co-author, “Rumen and cecum microbiomes in reindeer (Rangifer tarandus tarandus) are changed in response to a lichen diet and may effect enteric methane emissions” was just accepted for publication in PLOS ONE. In 2012 I went to Norway to apprentice for two weeks in the lab of Dr. Monica Sundset, and in 2013, Monica’s graduate student Alex came to the University of Vermont to apprentice in Dr. Andre Wright’s lab, where I taught him quantitative real-time PCR and some bioinformatics. Alex performed a feeding trial back in Norway, in which reindeer were fed a lichen-based diet, in order to assess changes in microbial diversity. Lichens contain usnic acid, which is toxic to ruminants. Reindeer; however, host some unique bacteria which degrade usnic acid in the rumen and allow the reindeer to eat them without dietary problems.
“Abstract
Reindeer (Rangifer tarandus tarandus) are large Holarctic herbivores whose heterogeneous diet has led to the development of a unique gastrointestinal microbiota, essential for the digestion of arctic flora, which may include a large proportion of lichens during winter. Lichens are rich in plant secondary metabolites, which may affect members of the gut microbial consortium, such as the methane-producing methanogenic archaea. Little is known about the effect of lichen consumption on the rumen and cecum microbiotas and how this may affect methanogenesis in reindeer. Here, we examined the effects of dietary lichens on the reindeer gut microbiota, especially methanogens. Samples from the rumen and cecum were collected from two groups of reindeer, fed either lichens (Ld: n = 4), or a standard pelleted feed (Pd: n = 3). Microbial densities (methanogens, bacteria and protozoa) were quantified using quantitative real-time PCR and methanogen and bacterial diversities were determined by 454 pyrosequencing of the 16S rRNA genes.
In general, the density of methanogens were not significantly affected (p>0.05) by the intake of lichens. Methanobrevibacter constituted the main archaeal genus (>95% of reads), with Mbr. thaueri CW as the dominant species in both groups of reindeer. Bacteria belonging to the uncharacterized Ruminococcaceae and the genus Prevotella were the dominant phylotypes in the rumen and cecum, in both diets (ranging between 16–38% total sequences). Bacteria belonging to the genus Ruminococcus (3.5% to 0.6%; p = 0.001) and uncharacterized phylotypes within the order Bacteroidales (8.4% to 1.3%; p = 0.027), were significantly decreased in the rumen of lichen-fed reindeer, but not in the cecum (p = 0.2 and p = 0.087, respectively). UniFrac-based analyses showed archaeal and bacterial libraries were significantly different between diets, in both the cecum and the rumen (vegan::Adonis: pseudo-F<0.05). Based upon previous literature, we suggest that the altered methanogen and bacterial profiles may account for expected lower methane emissions from lichen-fed reindeer.”
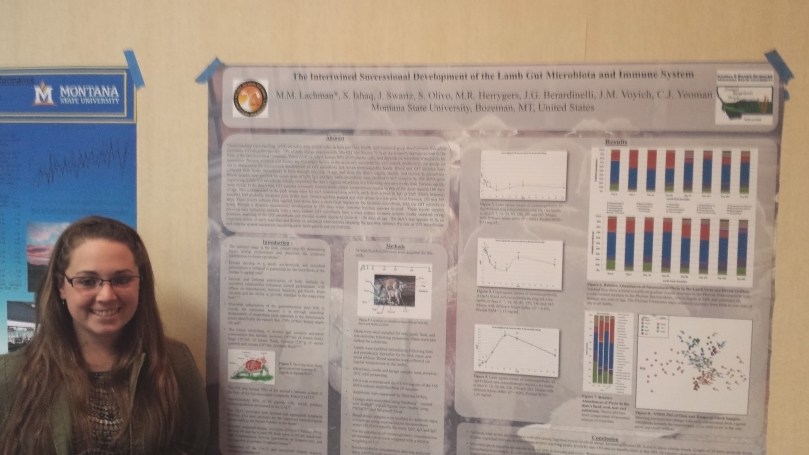
Medora Lachman, one of the graduate students in the Yeoman lab, won an award for a poster last week. I have been helping Medora to learn bioinformatics, and to wrangle her 1500 sequencing samples!
Repost from Yeoman Lab: “Congratulations to graduate student Medora Lachman who was awarded the Laurie Henneman Outstanding Student Presentation award for best graduate poster at the 2016 Montana Academy of Sciences annual meeting!!! Medora is studying the interrelationships between maternal nurturing, gut microbial succession, and immune maturation in ruminants. Medora’s research is supported by the Montana Agricultural Experiment Station, USDA’s W3177 multi-state project (Enhancing the competitiveness of US beef) funding, and by Land ‘o’ Lakes.”
In addition to the poster I’ll be presenting at ASM Microbe in Boston, I’ll be presenting two oral presentations at the Joint Annual Meeting in Salt Lake City, Utah in July. JAM brings together the American Society of Animal Science (ASAS), the American Dairy Science Association (ADSA), the Western Section of the American Society of Animal Science (WSASAS), and the Canadian Society of Animal Science (CSAS).
I’ll be presenting “Influence of colostrum on the microbiological diversity of the developing bovine intestinal tract” in the Ruminant Nutrition section, and “Ground redberry juniper and urea in DDGS-based supplements do not adversely affect ewe lamb rumen microbial communities” in the Small Ruminant section. Both projects are collaborations with the Yeoman Lab. Check back to my calendar in a few weeks to get more details on my presentations!
Today I went to the MSU Post Farm, one of the several agricultural farms affiliated with MSU Bozeman, along with several other members of the Menalled lab. We were going to count seedlings of the agricultural crop winter wheat, and a competitive weed, cheat grass.
The plots are left out in the field for ambient rain and temperature conditions, or put into one of two treatments, or both combined, to mimic climate change: increased temperatures and reduced rainfall. This is similar to the project I will be working on, so it’s good job training. And, those study cards that my mentee made me last week really did come in handy!
As my current post-doctoral position winds down in the Yeoman Lab in the Department of Animal and Range Sciences, I am pleased to announce that I have accepted a post-doctoral position in the Menalled Lab in the Land Resources and Environmental Sciences Department! Dr. Menalled’s work focuses on agricultural weed ecology and management, particularly with respect to plant-plant interactions, changing climate (water and temperature changes), and now plant-microbe interactions!
I’ll primarily be working on a new two-year project that recently got funded through the USDA, entitled “Assessing the vulnerability and resiliency of integrated crop-livestock organic systems in water-limited environments under current and predicted climate scenarios”, but I’ll also be working collaboratively on several other similar projects in the lab.
A little pre-job job training: I’m helping to make structures to keep rain out (rain-out shelters) of plots to simulate drier climate conditions. Photo: Tim Seipel
My new responsibilities will include comparing agronomic performance and weed-crop-pathogen interactions between organic-tilled and organic-grazed systems, evaluating the impact of management and biophysical variables on soil microbial communities, and collaborating in modeling the long-term consequences of these interactions under current and predicted climate scenarios. It’ll mean a lot more field work, and a lot of new skills to learn! In fact, to help me study for my new job working with agricultural plants, my mentee and her friend made me flash cards:
My mentee made my study cards so I could learn to identify common crop and weed species.
In addition to my new skills, I’ll be integrating my background in microbial ecology and bioinformatics, in order to study agricultural ecosystems more holistically and measure plant-microbe interactions. In the same way that humans eat probiotics to promote a healthy gut microbiome, plants foster good relationships with specific soil microorganisms. The most exciting part is that I will act as an interdisciplinary bridge between the agroecology of the Menalled lab and the microbial ecology of the Yeoman lab, which will allow for more effective collaborations!
Encouraging girls to go into STEM fields is really important; studies show that female STEM high-school teachers and even online mentors increase the probability of female students following a STEM education. Moreover, any child benefits academically and psychologically from having positive role models in their life, especially when they were role models that they interacted with as opposed to celebrity role models. And the benefits don’t just extend to children, adults benefit from positive rolemodels, too. Certainly I have benefited from strong female role models in my life, from high school art teachers, to undergraduate lecturers, to family (happy birthday, Mom!).
This past fall I started putting my money where my mouth was- I started mentoring an elementary school-aged girl in Bozeman, MT through the Thrive Child Advancement Project (CAP). So far, we have mostly been making art projects and talking about archaeology. But we have been talking about trying to learn the Java programming language together!
There are lots of opportunities to mentor kids, either through CAP programs, Big Brother/Big Sister, Girls and Boy Scouts, etc., just a quick internet search brings up dozens of local options. For less of a time commitment, you can also volunteer for community workshops, like the Girls for a Change summit in Bozeman or the Girls-n-Science in Billings.