I'm an assistant professor of animal and veterinary studies at the University of Maine, Orono, studying how animals get their microbes. I am also the Founder and Lead of the Microbes and Social Equity working group.
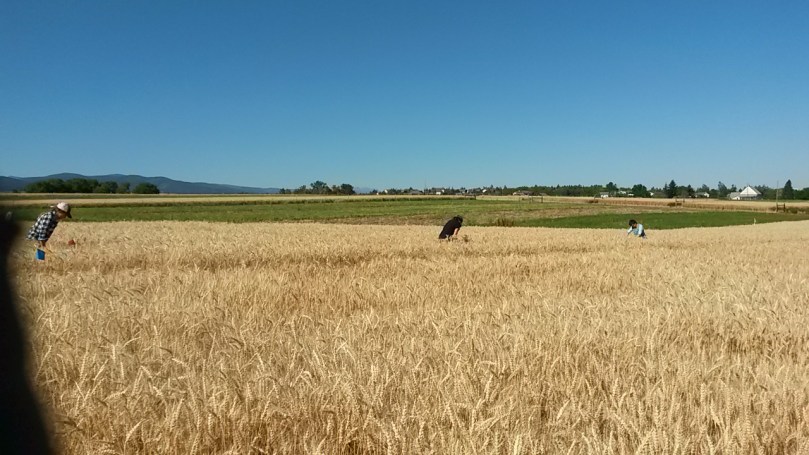
After a hot, dry summer growing season in Montana, the samples have all been collected and the crop harvested for my project investigating wheat production under farming system (organic vs. conventional), climate change (hot or hot and dry), disease (wheat streak virus), and weed competition (cheatgrass) conditions. We collected wheat and weed biomass from every subplot, totaling 108 bags of wheat and an estimated 500 bags of weeds! This will be weighed to determine production, and diversity (number of different weed species) will be assessed.
The biomass bags were temporarily stored in my office until we could find enough shelf space in the lab.
At the end of July, we also collected our final soil samples, which required over 500 grams of aseptically collected of soil in each subplot. With the extremely dry, clay-containing soil on the farm, this was no quick undertaking, and it took 6-7 lab members a total of 9 hours to collect all 108 samples! Those soil samples will be used for DNA sequencing to determine what microorganisms are present, and compared to other time points to see how they changed over the summer in response to our treatment conditions. The soil will also be measured for essential nutrients, such as nitrogen and carbon content, and saved to be used in a greenhouse experiment to look at the legacy effects of microbial change.
The samples might be collected, but we aren’t done yet. This was year one of a two-year project, and as winter wheat and cheatgrass need to be sown soon, before it gets cold, we have a lot of prep work to do. This includes resetting our data collection tools, including gypsum blocks for soil moisture and ibuttons for soil temperature. We will also need to set up our climate chamber equipment in all new subplots, since we are interested in third-year winter wheat that is part of a five-year crop rotation. We also plan to start a greenhouse experiment looking at the legacy effects of our soil this fall. Not to mention all of data to analyze over the winter months!
I’m here at the Joint Annual Meeting in Salt Lake City, Utah! JAM brings together the American Society of Animal Science (ASAS), the American Dairy Science Association (ADSA), the Western Section of the American Society of Animal Science (WSASAS), and the Canadian Society of Animal Science (CSAS).
I’ll be presenting “Influence of colostrum on the microbiological diversity of the developing bovine intestinal tract” in the Ruminant Nutrition section on Saturday morning, and “Ground redberry juniper and urea in DDGS-based supplements do not adversely affect ewe lamb rumen microbial communities” in the Small Ruminant section on Wednesday morning.
In May, 2016, I started a post doctoral position in a laboratory that focuses on weed management in agricultural systems, especially organic farms which don’t use chemical fertilizer or herbicide. My role is to integrate microbial ecology. For example, is the soil microorganism diversity different in fields that compete better against weeds than in fields that can’t? Are there certain microorganisms that make it easier for weeds to grow, and how do they do that? Can we suppress weeds by manipulating bacteria or fungi in the soil?
So far, I’ve been doing field work for my project, as well as assisting other lab members in their own projects, as many large scale greenhouse or field experiments require large groups of helpers to accomplish certain tasks. I’m also new to weed ecology, and I wanted to learn as much as possible. Thus, I put on some sunscreen and one of those vendor t-shirts you get when you order a certain dollar amount, and got to work.
Some of our projects investigate the link between crop health and climate change. To simulate climate change, we create rain-out shelters to mimic dry conditions, and plastic shielding to mimic hotter conditions.
Making climate change simulators.
The gypsum block will absorb soil moisture, and we can measure conductivity off of that.
This one is very dry.
One of the treatments is to infect crops with wheat streak mosaic virus, to determine whether climate change will affect the plant’s ability to fight infection, and whether it will change soil microbiota. To do this, we needed to infect our crops, which meant growing infected plants in the laboratory and selectively spreading them in the field as a slurry.
Blended wheat.
We need to filter out the particles or they will clog the sprayer. Also pictured: Dr. Fabian Menalled.
A similar project is using mites as a virus transmission vector, so we attached mite-infected wheat to healthy wheat.
Kyla and I are attaching wheat to other wheat with paperclips.
We hope the wheat mite get infected.
Another project is collecting data about ground beetle diversity in organic versus conventionally farmed soil. For this, we planted pitfalls traps in fields to collect and identify beetles.
Throughout many of the ongoing lab projects, I’ll be investigating the effect of treatments on soil health and diversity.
The core sampler is used to collect soil from certain depths.
The soil is then put in sterile containers until analysis.
My project is part of a larger experiment, which also involves assessing crop and weed communities. For this, we need to randomly sample plants in the field and collect all above-ground plant material (to measure biomass as weight), as well as the biomass of each individual weed species to measure diversity (number of different weed species) and density (how large the plants are actually growing).
This slideshow requires JavaScript.
And, of course, there is plenty of weed species identification!
Field bindweed (Convolvulus arvensis) is an invasive plant related to morning glories. Their winding vines grow into a tangled mass which can strangle other plants, and a single plant can produce hundreds of seeds. The plants can also store nutrients in the roots which allow them to regrow from fragments, thus it can be very difficult to get rid of field bindweed. It will return even after chemical or physical control (tilling or livestock grazing), but it does not tolerate shade very well. Thus, a more competitive crop, such as a taller wheat which will shade out nearby shorter plants, reduce the viability of bindweed.
Bindweed wraps around other plants.
This patch goes all the way to Lazarro.
First seen in the US in 1739, Field bindweed is native to the Mediterranean. By 1891, it had made its way west and was identified in Missoula, Montana. As of 2016, it has been reported from all but two counties in Montana, where it has been deemed “noxious” by the state department (meaning that it has been designated as harmful to agriculture (or public health, wildlife, property). In the field, this can be visually striking, as pictured below. In the foreground, MSU graduate student Tessa Scott (lead researcher on this project) is standing in a patch of wheat infested with bindweed. Just seven feet away in the background, undergraduate Lazarro Vinola is standing in non-infested wheat, with soil core samplers used for height reference.
In agricultural fields, bindweed infestations severely inhibit crop growth and health.
Last week, Tessa, Lazarro, and I went to several farms in and around Big Sandy and Lewistown, Montana in order to sample fields battling field bindweed. To do so, we harvested wheat, field bindweed, and other weed biomass by cutting all above-ground plant material inside a harvesting frame. These will be dried and weighed, to measure infestation load and the effect on wheat production.
The sampling locations are consistent with previous years to track how different farm management practices influence infestations. This means using GPS coordinates to hike out to spots in the middle of large fields.
This slideshow requires JavaScript.
It also means getting very dirty driving and walking through dusty fields!
Thalspi, or pennycress, which is dropping seeds even in my shoes!
The van did very well on rocky, uneven field roads!
Several years ago, during my Ph.D. at the University of Vermont, I provided wet-lab and DNA sequence analysis work for a project investigating the health effects of a low or high fat diet on mice with Dr. Huawei Zeng of the USDA Agricultural Research Service. It was just recently published in the Journal of Nutritional Biochemistry!
Abstract
Consumption of an obesigenic/high-fat diet (HFD) is associated with a high colon cancer risk and may alter the gut microbiota. To test the hypothesis that long-term high-fat (HF) feeding accelerates inflammatory process and changes gut microbiome composition, C57BL/6 mice were fed HFD (45% energy) or a low-fat (LF) diet (10% energy) for 36 weeks. At the end of the study, body weights in the HF group were 35% greater than those in the LF group. These changes were associated with dramatic increases in body fat composition, inflammatory cell infiltration, inducible nitric oxide synthase protein concentration and cell proliferation marker (Ki67) in ileum and colon. Similarly, β-catenin expression was increased in colon (but not ileum). Consistent with gut inflammation phenotype, we also found that plasma leptin, interleukin 6 and tumor necrosis factor α concentrations were also elevated in mice fed the HFD, indicative of chronic inflammation. Fecal DNA was extracted and the V1–V3 hypervariable region of the microbial 16S rRNA gene was amplified using primers suitable for 454 pyrosequencing. Compared to the LF group, the HF group had high proportions of bacteria from the family Lachnospiraceae/Streptococcaceae, which is known to be involved in the development of metabolic disorders, diabetes and colon cancer. Taken together, our data demonstrate, for the first time, that long-term HF consumption not only increases inflammatory status but also accompanies an increase of colonic β-catenin signaling and Lachnospiraceae/Streptococcaceae bacteria in the hind gut of C57BL/6 mice.
For the last four days I was in Boston for the American Society for Microbiology (ASM) Microbe 2016 meeting.The meeting is held in Boston on even years, and New Orleans on odd.
The conference brings together all sorts of microbiologists: from earth sciences, to host-associated, to clinical pathologists and epidemiologists, to educators. This year, there were reportedly over 11,000 participants! Because of the wide variety of topics, there is always an interesting lecture going on related to your topic, and it was a wonderful experience to be able to talk directly to other researchers to learn about the clever techniques they are using. I posted about a tiny fraction of those interesting projects on Give Me The Short Version.
On Sunday, I presented a poster on “Farming Systems Modify The Impact Of Inoculum On Soil Microbial Diversity.” I analyzed the data from this project for the Menalled Lab last year, and it has developed into a manuscript in review, as well as several additional projects in development.
One of the best parts of ASM meetings is that you never know who you are going to run into, and I was able to meet up with several friends and colleagues, including Dr. Benoit St-Pierre, who was a post-doc in the Wright lab at the University of Vermont while I was a student, and Laura Cersosimo, the other Ph.D. candidate from the UVM Wright lab who will be defending in just a few months! I also ran into Ph.D. candidate Robert Mugabi, who is hoping to defend by March and in the Barlow lab at UVM while I was there. Most unexpectedly, I ran into a A Lost Microbiologist who had wandered in from Norway: Dr. Nicole Podnecky, who I met at UVM back when we were undergraduates!
This slideshow requires JavaScript.
Of course, no conference would be complete without vendor swag.
Vendor swag! And not even all of it…
Ice cream made using liquid nitrogen from the Witches of Boston.
Today I’ll be presenting a poster on “Farming Systems Modify The Impact Of Inoculum On Soil Microbial Diversity.” at the American Society for Microbiology (ASM) Microbe 2016 meeting.
Come find me in the poster hall from 12:30 pm to 2:30 pm, poster number SUNDAY-053.
Stay tuned for the electronic poster, which will be uploaded after my presentation (as per ASM regulations).
Scientific conferences are a great place to get your name out there, discuss research with colleagues, and meet other researchers with whom you might one day collaborate. It can be difficult to get noticed as a graduate student or post-doctoral researcher, especially if it’s your first time at a certain conference, if your poster time conflicts with more interesting events, or if you find yourself way at the back of a 1,000 poster hall. You need to be ready to introduce yourself and get your point across, and to do it in a memorable and concise way. There may be hundreds or even thousands of people in attendance, so you need to make a fast impression.
Too much info on your card? A black background is slimming.
Though a bit outdated these days, I find business cards really handy. Not only can you quickly hand out all your information, but you can write notes on the back about what you discussed with someone so you can follow up with them later. It’s easy to leave a bag of them at your poster for people to take, too.
Not only is your poster or presentation’s content important, its visual appeal will help draw in people who are “browsing”. Make sure your font is large enough to read from 5-8 ft away, and that you have some color, but not enough to make text illegible. Bolding or bulleting take-home messages can also be really helpful. Make sure you can describe your poster in a variety of ways: in under 60 seconds to the person with a mild passing interest, and in-depth with the person that is curious about your methods or your other projects.
The most important thing to prepare, though, is yourself. You are representing yourself, your institution, and your science. Cleanliness, organization, and confidence make a huge difference when meeting new people, and will make you more approachable. Make eye contact, try to avoid filler words, and smile! I have watched posters get overwhelmingly passed by because the presenter was on their phone, or looked bored or annoyed. Making eye contact and saying hello to someone as they walk by is often enough to get them to slow down and ask you about your work.
If nothing else, a brightly colored shirt will attract attention to you and your poster.
When asking questions at other presentations, be sure to be polite; being demanding or rude is guaranteed to be met with disapproval from the rest of the audience. And go ahead and introduce yourself to other researchers, just be sure to keep it brief and don’t interrupt another meeting.
One more thing to consider at a conference is your behavior outside of your presentation. You are at a gathering of intellectuals who may one day be your boss, your colleague, your grant reviewer, or otherwise influential in your career. They may remember that they saw you talking loudly to a friend during a presentation, or that you got too drunk at the opening session. Conferences are often used as an excuse to take a concurrent vacation, especially for those in academia who generally can’t take a week off during the semester. But you should remember why you are there and act professionally, especially as a graduate student or post-doc, because you never know who’ll remember you in the future.
Bioinformatics brings statistics, mathematics, and computer programming to biology and other sciences. In my area, it allows for the analysis of massive amounts of genomic (DNA), transcriptomic (RNA), proteomic (proteins), or metabolomic (metabolites) data.
In recent years, the advances in sequencing have allowed for the large-scale investigation of a variety of microbiomes. Microbiome refers to the collective genetic material or genomes of all the microorganisms in a specific environment, such as the digestive tract or the elbow. The term microbiome is often casually thrown around: some people mistakenly use it interchangeably with “microbiota”, or use it to describe only the genetic material of a specific type of microorganism (i.e. “microbiome” instead of “bacterial microbiome”). Not only have targeted, or amplicon sequencing techniques improved, but methods that use single or multiple whole genomes have become much more efficient. In both cases, this has resulted in more sequences being amplified more times. This creates “sequencing depth”, a.k.a. better “coverage”: if you can sequence one piece of DNA 10 times instead of just once of twice, then you can determine if changes in the sequence are random errors or really there. Unfortunately, faster sequencing techniques usually have more spontaneous errors, so your data are “messy” and harder to deal with. More and messier data creates the problem of handling data.
The grey lines on the right represent sequence pieces reassembled into a genome, with white showing gaps. The colored lines represent a nucleotide that is different from the reference genome, usually just a random error in one sequence. The red bar shows where each sequence has a nucleotide different from that of the reference genome, indicating that this bacterial strain really is different there. This is a single nucleotide polymorphism (SNP).
DNA analysis requires very complex mathematical equations in order to have a standardized way to quantitatively and statistically compare two or two million DNA sequences. For example, you can use equations for estimating entropy (chaos) and estimate how many sequences you might be missing due to sequencing shortcomings based on how homogeneous (similar) or varied your dataset is. If you look at your data in chunks of 100 sequences, and 90 of them are different from each other, then sequencing your dataset again will probably turn up something new. But if 90 are the same, you have likely found nearly all the species in that sample.
Bioinformatics takes these complex equations and uses computer programs to break them down into many simple pieces and automate them. However, the more data you have, the more equations the computer will need to do, and the larger your files will be. Thus, many researchers are limited by how much data they can process.
Mr. DNA, Jurassic Park (1993)
There are several challenges to analyzing any dataset. The first is assembly.
Sequencing technology can only add so many nucleotide bases to a synthesized sequence before it starts introducing more and more errors, or just stops adding altogether. To combat this increase in errors, DNA or RNA is cut into small fragments, or primers are used to amplify only certain small regions. These pieces can be sequenced from one end to another, or can be sequenced starting at both ends and working towards the middle to create a region of overlap. In that case, to assemble, the computer needs to match up both ends and create one contiguous segment (“contig”). With some platforms, like Illumina, the computer tags each sequence by where on the plate it was, so it knows which forward piece matches which reverse.
When sequencing an entire genome (or many), the pieces are enzymatically cut, or sheared by vibrating them at a certain frequency, and all the pieces are sequenced multiple times. The computer then needs to match the ends up using short pieces of overlap. This can be very resource-intensive for the computer, depending on how many pieces you need to put back together, and whether you have a reference genome for it to use (like the picture on a puzzle box), or whether you are doing it de novo from scratch (putting together a puzzle without a picture, by trial and error, two pieces at a time).
Once assembled into their respective consensus sequences, you need to quality-check the data.
This can take a significant amount of time, depending on how you go about it. It also requires good judgement, and a willingness to re-run the steps with different parameters to see what will happen. An easy and quick way is to have the computer throw out any data below a certain threshold: longer or shorter than what your target sequence length was, ambiguous bases (N) which the computer couldn’t call as a primary nucleotide (A, T, C, or G), or the confidence level (quality score) of the base call was low. These scores are generated by the sequencing machine as a relative measure of how “confident” the base call is, and this roughly translates to potential number of base call errors (ex. marking it an A instead of a T) per 1,000 bases. You can also cut off low-quality pieces, like the very beginning or ends of sequences which tend to sequence poorly and have low quality. This is a great example of where judgement is needed: if you quality-check and trim off low quality bases first, and then assemble, you are likely to have cut off the overlapping ends which end up in the middle of a contig and won’t be able to put the two halves together. If you assemble first, you might end up with a sequence that is low-quality in the middle, or very short if you trim it on the low quality portions. If your run did not sequence well and you have lot of spontaneous errors, you will have to decide whether to work with a lot of poor-quality data, or a small amount of good-quality data leftover after you trim out the rest, or spend the money to try and re-sequence.
There are several steps that I like to add, some of which are necessary and some which are technically optional. One of them is to look for chimeras, which are two sequence pieces that mistakenly got joined together. This happens during the PCR amplification step, often if there is an inconsistent electrical current or other technical problem with the machine. While time- and processor-consuming, chimera checking can remove these fake sequences before you accidentally think you’ve discovered a new species. Your screen might end up looking something like this…
Actual and common screen-shot… but I am familiar enough with it to be able to interpret!
Eventually, you can taxonomically and statistically assess your data.
Ishaq and Wright, 2014, Microbial Ecology
In order to assign taxonomic identification (ex. genus or species) to a sequence, you need to have a reference database. This is a list of sequences labelled with their taxonomy (ex. Bacillus licheniformis), so that you can match your sequences to the reference and identify what you have. There are several pre-made ones publicly available, but in many cases you need to add to or edit these, and several times I have made my own using available data in online databases.
Ishaq and Wright, 2014, Microbial Ecology
You can also statistically compare your samples. This can get complicated, but in essence tries to mathematically compare datasets to determine if they are actually different, and if that difference could have happened by chance or not. You can determine if organically-farmed soil contains more diversity than conventionally-farmed soils. Or whether you have enough sequencing coverage, or need to go back and do another run. You can also see trends across the data, for example, whether moose from different geographic locations have similar bacterial diversity to each other (left). Or whether certain species or environmental factors have a positive/negative/ or no correlation (below).
Bioinformatics can be complicated and frustrating, especially because computers are very literal machines and need to have things written in very specific ways to get them to accomplish tasks. They also aren’t very good at telling you what you are doing wrong; sometimes it’s as simple as having a space where it’s not supposed to be. It takes dedication and patience to go back through code to look for minute errors, or to backtrack in an analysis and figure out at which step several thousand sequences disappeared and why. Like any skill, computer science and bioinformatics take time and practice to master. In the end, the interpretation of the data and identifying trends can be really interesting, and it’s really rewarding when you finally manage to get your statistical program to create a particularly complicated graph!
Stay tuned for an in-depth look at my current post-doctoral work with weed management in agriculture and soil microbial diversity!
A manuscript that I helped co-author, “Rumen and cecum microbiomes in reindeer (Rangifer tarandus tarandus) are changed in response to a lichen diet and may effect enteric methane emissions” was just accepted for publication in PLOS ONE. In 2012 I went to Norway to apprentice for two weeks in the lab of Dr. Monica Sundset, and in 2013, Monica’s graduate student Alex came to the University of Vermont to apprentice in Dr. Andre Wright’s lab, where I taught him quantitative real-time PCR and some bioinformatics. Alex performed a feeding trial back in Norway, in which reindeer were fed a lichen-based diet, in order to assess changes in microbial diversity. Lichens contain usnic acid, which is toxic to ruminants. Reindeer; however, host some unique bacteria which degrade usnic acid in the rumen and allow the reindeer to eat them without dietary problems.
“Abstract
Reindeer (Rangifer tarandus tarandus) are large Holarctic herbivores whose heterogeneous diet has led to the development of a unique gastrointestinal microbiota, essential for the digestion of arctic flora, which may include a large proportion of lichens during winter. Lichens are rich in plant secondary metabolites, which may affect members of the gut microbial consortium, such as the methane-producing methanogenic archaea. Little is known about the effect of lichen consumption on the rumen and cecum microbiotas and how this may affect methanogenesis in reindeer. Here, we examined the effects of dietary lichens on the reindeer gut microbiota, especially methanogens. Samples from the rumen and cecum were collected from two groups of reindeer, fed either lichens (Ld: n = 4), or a standard pelleted feed (Pd: n = 3). Microbial densities (methanogens, bacteria and protozoa) were quantified using quantitative real-time PCR and methanogen and bacterial diversities were determined by 454 pyrosequencing of the 16S rRNA genes.
In general, the density of methanogens were not significantly affected (p>0.05) by the intake of lichens. Methanobrevibacter constituted the main archaeal genus (>95% of reads), with Mbr. thaueri CW as the dominant species in both groups of reindeer. Bacteria belonging to the uncharacterized Ruminococcaceae and the genus Prevotella were the dominant phylotypes in the rumen and cecum, in both diets (ranging between 16–38% total sequences). Bacteria belonging to the genus Ruminococcus (3.5% to 0.6%; p = 0.001) and uncharacterized phylotypes within the order Bacteroidales (8.4% to 1.3%; p = 0.027), were significantly decreased in the rumen of lichen-fed reindeer, but not in the cecum (p = 0.2 and p = 0.087, respectively). UniFrac-based analyses showed archaeal and bacterial libraries were significantly different between diets, in both the cecum and the rumen (vegan::Adonis: pseudo-F<0.05). Based upon previous literature, we suggest that the altered methanogen and bacterial profiles may account for expected lower methane emissions from lichen-fed reindeer.”